The global MPI highlights inequalities at the global, regional, national and subnational levels. Each layer of analysis yields a new understanding of inequality and provides a far richer picture than the $1.90 a day poverty rate.
Incidence and intensity
The MPI is the product of the incidence (number or percentage of poor people) and the intensity (average number of deprivations suffered by the poor) of multidimensional poverty, and both are important aspects. Any reduction in intensity reduces MPI (even if incidence remains unchanged) and reflects progress towards moving people out of poverty. The poorest countries exhibit not just higher incidence of multidimensional poverty, but also higher intensity, with the average poor person deprived in more indicators. Some countries have similar incidences but very different intensities. The incidence of multidimensional poverty in Pakistan and Myanmar is 38.3 percent, but the intensity is considerably higher in Pakistan (51.7 percent) than in Myanmar (45.9 percent). Another stark contrast is Nigeria, with incidence of 51.4 percent and intensity of 56.6 percent, and Malawi, with incidence of 52.6 percent, and intensity of 46.2 percent.
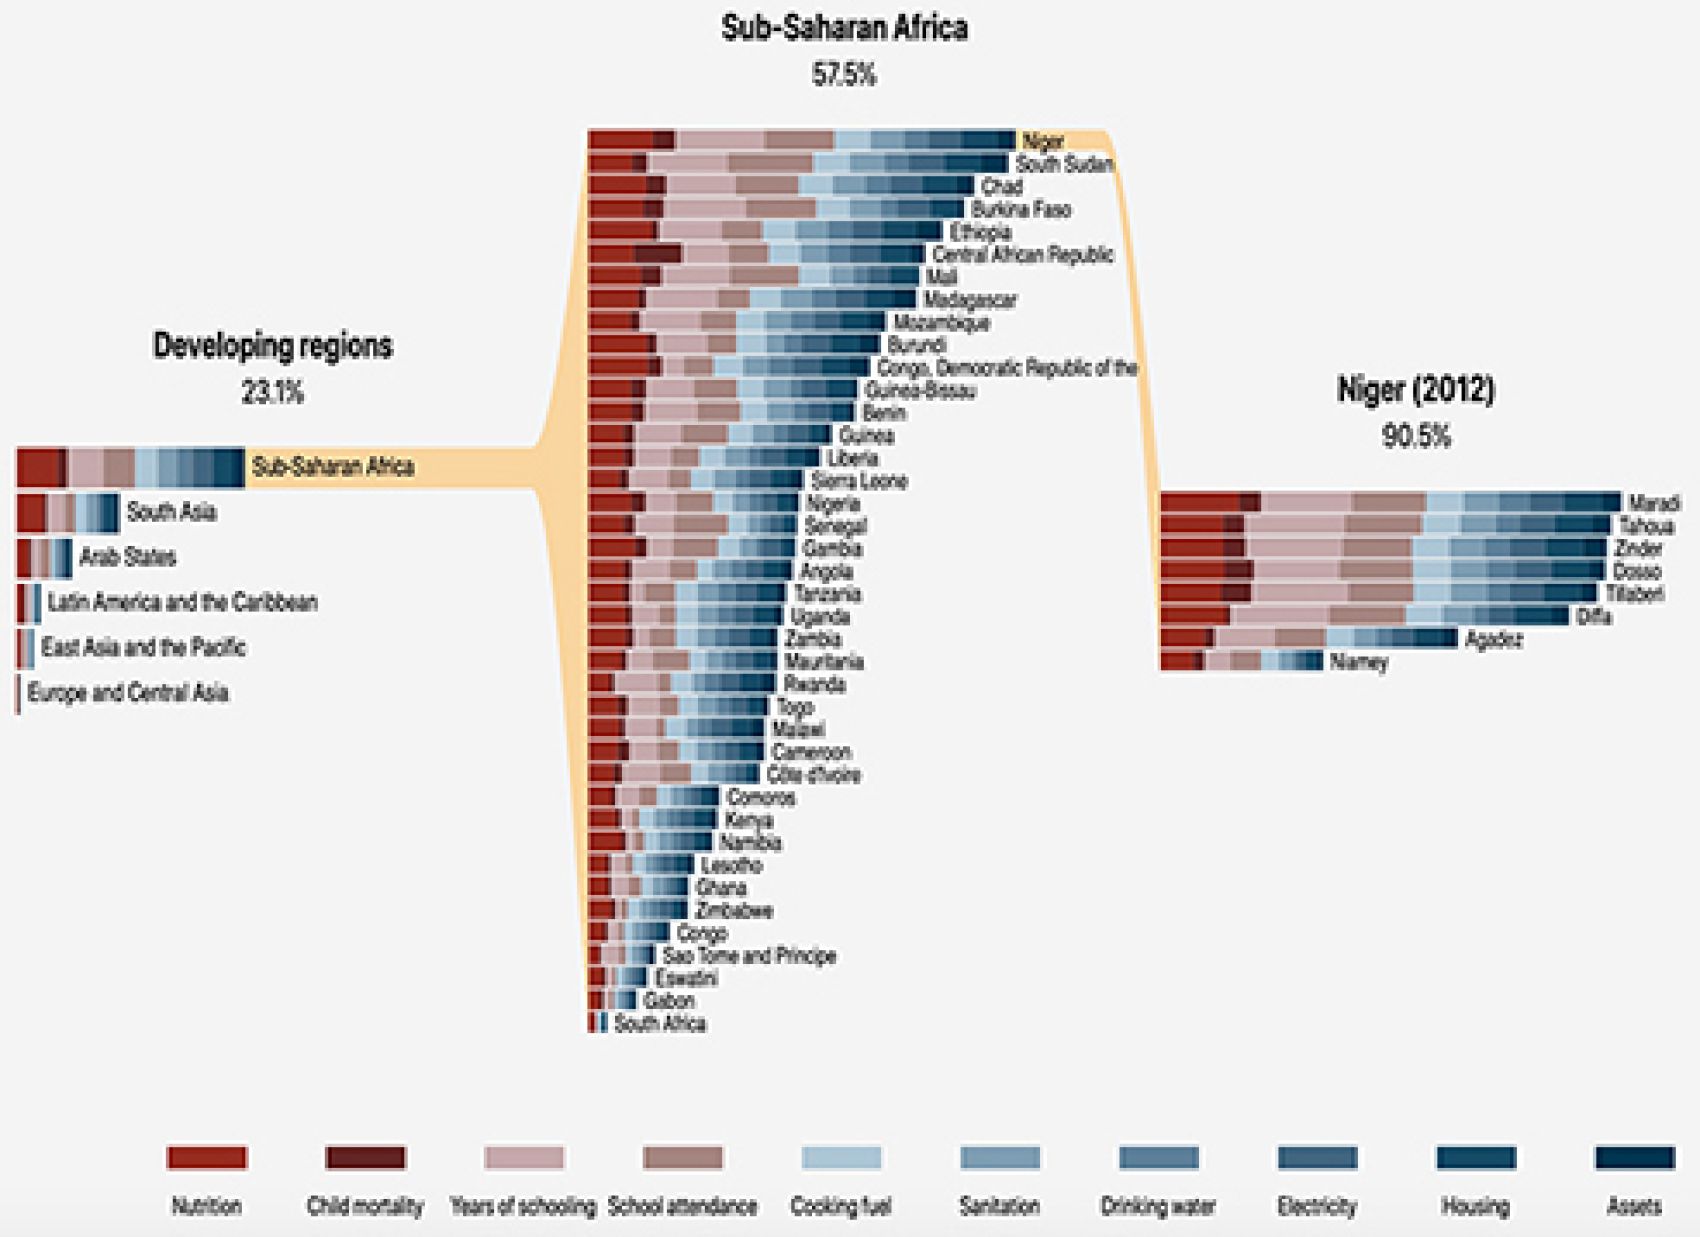
Across the 101 countries covered by the global MPI, 23.1 percent of people are multidimensionally poor, but the incidence of multidimensional poverty varies across developing regions—from 1.1 percent in Europe and Central Asia to 57.5 percent in Sub-Saharan Africa. In Sub-Saharan Africa, the incidence varies across countries—from 6.3 percent in South Africa to 91.9 percent in South Sudan.
The interactive visualization below lets us explore the incidence of multidimensional poverty and contribution of deprivation in each indicator to overall multidimensional poverty at the developing region, national and subnational levels. Start by selecting a region, then a country.
Contribution of deprivation in each indicator to overall multidimensional poverty Percent values represent incidence of multidimensional poverty Nutrition Child mortality Years of schooling School attendance Cooking fuel Sanitation Drinking water Electricity Housing Assets Developing regions 23.1%
Stark inequalities across countries in the same developing region
In Sub-Saharan Africa the incidence of multidimensional poverty is 91.9 percent in South Sudan and 90.5 percent in Niger but 14.8 percent in Gabon and 6.3 percent in South Africa. In South Asia it is 55.9 percent in Afghanistan but 0.8 percent in the Maldives. In the Arab States it is 52.3 percent in Sudan and 47.7 percent in Yemen but less than 1.0 percent in Jordan. In Latin America it is 41.3 percent in Haiti but 0.6 percent in Trinidad and Tobago. In East Asia and the Pacific it is 45.8 percent in Timor-Leste but 3.9 percent in China and 0.8 percent in Thailand. In Europe and Central Asia it is 7.4 percent in Tajikistan but 0.2 percent in Armenia.
Within countries, the incidence varies across subnational regions. For instance, the incidence of multidimensional poverty in Uganda is 55.1 percent—similar to the Sub-Saharan Africa average. But within Uganda, the incidence ranges from 6.0 percent in Kampala to 96.3 percent in Karamoja— meaning that some regions of the country have an incidence similar to that of South Africa, while others have an incidence similar to that of South Sudan.
Poverty is everywhere
Action against poverty is needed in all developing regions. While Sub-Saharan Africa and South Asia are home to the largest proportions of multidimensionally poor people (84.5 percent of all multidimensionally poor people live in the two regions), countries in other parts of the world also have a high incidence of multidimensional poverty: Sudan (52.3 percent), Yemen (47.7 percent), Timor-Leste (45.8 percent) and Haiti (41.3 percent).
The Human Development Report Office extends its sincere gratitude to the Republic of Korea for its financial support for the publication of the 2019 Multidimensional Poverty Index and interactive presentation of the MPI data.