Gender Inequality Index (GII)

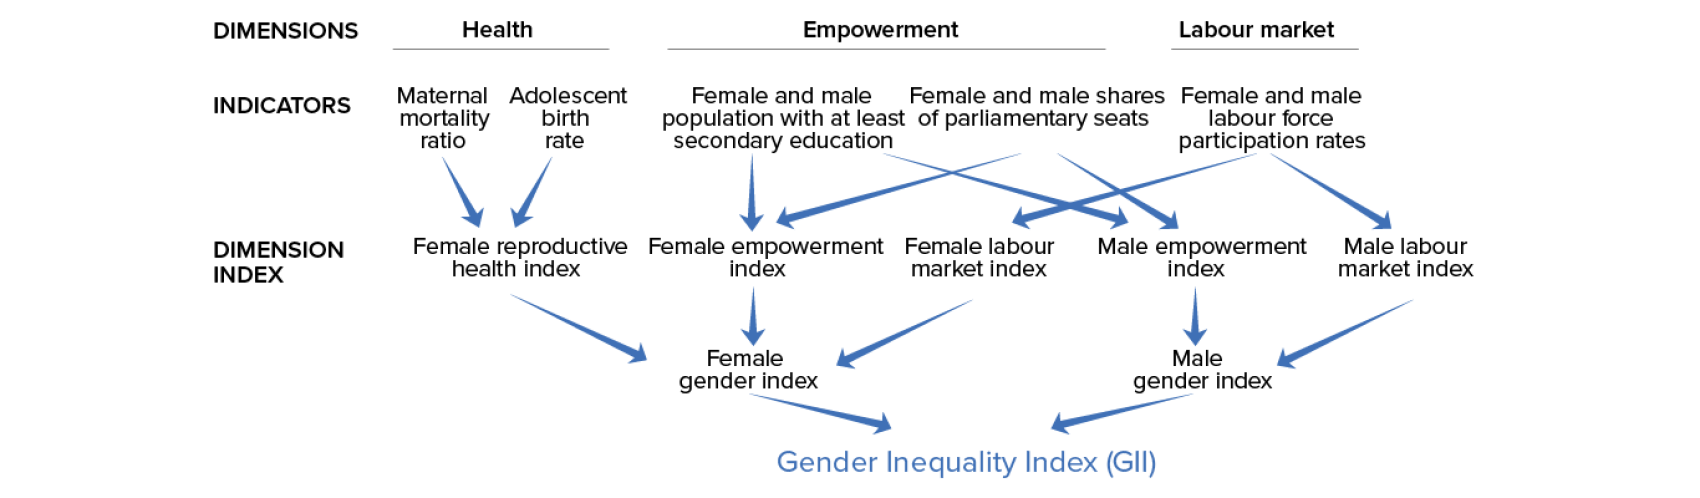
GII is a composite metric of gender inequality using three dimensions: reproductive health, empowerment and the labour market. A low GII value indicates low inequality between women and men, and vice-versa.
About GII
GII reflects gender-based disadvantage in three dimensions— reproductive health, empowerment and the labour market—for as many countries as data of reasonable quality allow. It shows the loss in potential human development due to inequality between female and male achievements in these dimensions. It ranges from 0, where women and men fare equally, to 1, where one gender fares as poorly as possible in all measured dimensions. GII values are computed using the association-sensitive inequality measure suggested by Seth (2009), which implies that the index is based on the general mean of general means of different orders—the first aggregation is by a geometric mean across dimensions; these means, calculated separately for women and men, are then aggregated using a harmonic mean across genders.
Dimensions and Indicators