The first Human Development Report introduced a new way of measuring development by combining indicators of life expectancy, educational attainment and income into a composite human development index, the HDI. The breakthrough for the HDI was the creation of a single statistic which was to serve as a frame of reference for both social and economic development. The HDI sets a minimum and a maximum for each dimension, called goalposts, and then shows where each country stands in relation to these goalposts, expressed as a value between 0 and 1.

The education component of the HDI is now measured by mean of years of schooling for adults aged 25 years and expected years of schooling for children of school entering age. Mean years of schooling is estimated based on educational attainment data from censuses and surveys available in the UNESCO Institute for Statistics database and Barro and Lee (2010) methodology). Expected years of schooling estimates are based on enrolment by age at all levels of education and population of official school age for each level of education. Expected years of schooling is capped at 18 years. The indicators are normalized using a minimum value of zero and maximum values are set to the actual observed maximum value of mean years of schooling from the countries in the time series, 1980–2012, that is 13.3 years estimated for the United States in 2010. Expected years of schooling is maximized by its cap at 18 years. The education index is the geometric mean of two indices.
The life expectancy at birth component of the HDI is calculated using a minimum value of 20 years and maximum value of 83.57 years. This is the observed maximum value of the indicators from the countries in the time series, 1980–2012. Thus, the longevity component for a country where life expectancy birth is 55 years would be 0.551.
For the wealth component, the goalpost for minimum income is $100 (PPP) and the maximum is $87,478 (PPP), estimated for Qatar in 2012.
The decent standard of living component is measured by GNI per capita (PPP$) instead of GDP per capita (PPP$) The HDI uses the logarithm of income, to reflect the diminishing importance of income with increasing GNI. The scores for the three HDI dimension indices are then aggregated into a composite index using geometric mean. Refer to the Statistics [614 KB] for more details and the HDR 2013 Technical Notes English [153 KB].
The HDI facilitates instructive comparisons of the experiences within and between different countries.
To learn more:
One way the use of the human development index has been improved is through disaggregation. A country's overall index can conceal the fact that different groups within the country have very different levels of human development. Disaggregated HDIs are arrived at by using the data for the HDI components pertaining to each of the separate groups; treating each group as if it was a separate country. Such groups may be defined relative to income, geographical or administrative regions, urban/rural residence, gender and ethnicity. Using disaggregated HDIs at the national and sub-national levels helps highlight the significant disparities and gaps: among regions, between the sexes, between urban and rural areas and among ethnic groups. The analysis made possible by the use of the disaggregated HDIs should help guide policy and action to address gaps and inequalities.
Disparities may already be well known, but the HDI can reveal them even more starkly. Disaggregation by social group or region can also enable local community groups to press for more resources as well as to force accountability on local representatives, making the HDI a tool for participatory development.
Disaggregated HDIs have been used extensively for analysis since their inception.
In 2010, the Inequality-adjusted HDI (IHDI) was introduced. The IHDI is the HDI adjusted for inequalities in the distribution of achievements in each of the three dimensions of the HDI (health, education and income). The IHDI will be equal to the HDI value when there is no inequality, but falls below the HDI value as inequality rises. The difference between the HDI and the IHDI represents the ‘loss’ in potential human development due to inequality and can be expressed as a percentage. In 2012 the IHDI was calculated for 132 countries and the results are telling. For example, United States suffers a loss of more than 12% when its HDI value is adjusted for inequalities and moves 13 places down in rank.
To reflect country-specific priorities and problems and to be more sensitive to a country's level of development, the HDI appearing in the global HDRs can be tailored so that additional components are included in the calculation. HDI adjustments should utilize the methods of weighting and normalization as the original HDI, making use of maximum and minimum values to create an index for the added component. In addition, indicator-specific weights can be tailored such that they reflect national policy priorities.
Additional adjustments to the HDI could involve expanding the breadth of existing component indices. For example, the life expectancy category could be adjusted to reflect under-five or maternal mortality rates; the income component could be adjusted to reflect unemployment, incidence of income poverty or the Gini-corrected mean national income; and finally the educational component can be adjusted to include the number of students enrolled in particularly important fields of study, such as the mathematics and sciences.
It is difficult to use the HDI to monitor changes in human development in the short-term because two of its components, namely life expectancy and mean years of schooling change slowly. To address this limitation, components that are more sensitive to short-term changes could used for national purposes, possibly under a different name. For example, the rate of employment, the percent of population with access to health services, or the daily caloric intake as a percentage of recommended intake could be used in place of the traditional indicators of the HDI.
Thus, the usefulness and versatility of the HDI as an analytical tool for HD at the national and sub-national levels would be enhanced if countries choose components that reflect their priorities and problems and are sensitive to their development levels, rather than rigidly using the three components presented in the HDI of the global HDRs.
As previously mentioned, when adjusting the HDI to reflect additional concerns, a commitment to data integrity and rigorous attention to statistical protocol should always be a concern of paramount importance.
National wealth has the potential to expand people's choices. However, it may not. The manner in which countries spend their wealth, not the wealth itself, is decisive. Moreover, an excessive obsession with the creation of material wealth can obscure the ultimate objective of enriching human lives. In many instances, countries with higher average incomes have higher average life expectancies, lower rates of infant and child mortality and higher educational attainment and school enrollment, and consequently a higher human development index (HDI). But these associations are far from perfect. In inter-country comparisons, income variations tend to explain not much more than half the variation in life expectancy, or in infant and child mortality. And they explain an even smaller part of the differences in adult educational attainment.
Although there is a correlation between material wealth and human well-being, it breaks down in many societies. Many countries have high GNI per capita, but low human development indicators and vice versa, while some countries at similar levels of GNI per capita have vastly different levels of human development.
Given the imperfect nature of wealth as gauge of human development, the HDI offers a powerful alternative to GDP and GNI for measuring the relative socio-economic progress at national and sub-national levels. Comparing HDI and per capita income ranks of countries, regions or ethnic groups within countries highlights the relationship between their material wealth on the one hand and their human development on the other. A negative gap implies the potential of redirecting resources to Human Development.
The Human Development Index (HDI) is a composite measure of health, education and income that was introduced in the first Human Development Report in 1990 as an alternative to purely economic assessments of national progress, such as GDP growth. It soon became the most widely accepted and cited measure of its kind, and has been adapted for national use by many countries. HDI values and rankings in the global Human Development Report are calculated using the latest internationally comparable data from mandated international data providers. Previous HDI values and rankings are retroactively recalculated using the same updated data sets and current methodologies, and are presented in Table 2 of the Statistical Annex of the 2013 Report. The HDI rankings and values in the 2013 Human Development Report cannot therefore be compared directly to HDI rankings and values published in previous Human Development Reports.
The 2012 HDI covers 187 countries, the same number as in 2011, while only 169 were included in the 2010 HDI. This major expansion of HDI coverage is the result of intensified efforts by the Human Development Report office to work with international data providers and national statistical agencies to obtain required development indicators for the HDI which had been unavailable for some countries in previous years.
Data constraints precluded HDI estimates for member states: Marshall Islands, Monaco, Nauru, the People’s Democratic Republic of Korea, San Marino, Somalia, South Sudan and Tuvalu.
The new HDI rankings introduce the concept of the statistical tie for the first time since the HDI was introduced in the first Human Development Report in 1990, for countries with HDI values that are identical to at least three decimal points. Ireland and Sweden, each with an HDI value of 0.916, are both ranked #7 in the new HDI, for example, though the two countries’ HDI values diverge when calculated to four or more decimal points.
After consultations with many leading experts in development measurement, we concluded that differences beyond a thousandth of a percent are statistically insignificant. When two countries are so close in their HDI values, sharing the same ranking is more accurate and fair. (For more information: Aguna and Kovacevic, 2011: http://hdr.undp.org/en/reports/global/hdr2010/papers/HDRP_2010_47.pdf)The HDI was created to emphasize that people and their capabilities should be the ultimate criteria for assessing the development of a country, not economic growth alone.
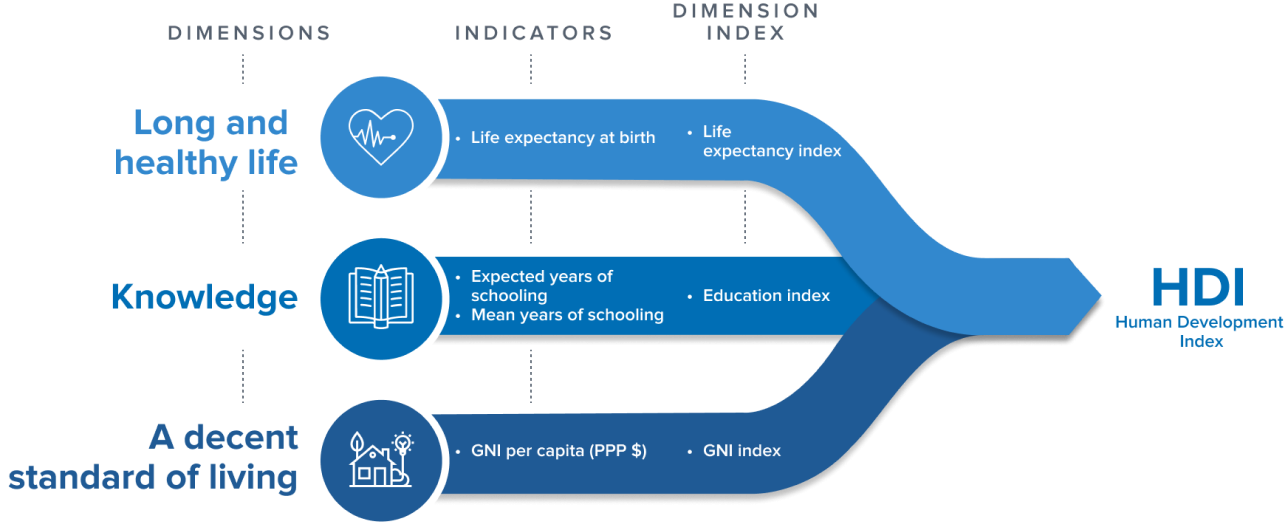
 The HDI can also be used to question national policy choices, asking how two countries with the same level of GNI per capita can end up with such different human development outcomes. For example, the Bahamas’ GNI per capita is higher than New Zealand’s (by 17%) but life expectancy at birth is about 5 years shorter, mean years of schooling is 4 years shorter and expected years of schooling differ greatly between the two countries, resulting in New Zealand having a much higher HDI value than the Bahamas. These striking contrasts can stimulate debate about government policy priorities.
Health (Life expectancy): The UN Population Division revised its life expectancy series biennially, which sometimes creates both increases and decreases for many countries. Just like in 2011, the life expectancy at birth data used for this year’s HDI and its trends are from the 2010 Revision of the World Population Prospects.
Education (“Expected years of schooling” and “Mean years of schooling”): Because HDRO must rely on data from international organizations that provide data which are comparable across countries, the data contained in the 2013 Report may not match data from national surveys. Data for mean years of schooling (for the current adult population 25 years and older) are similar to those used in the 2011 Report and they refer to year 2010, unless specified differently.
Gross national income: Gross national income per capita is expressed in constant purchasing-power-parity (PPP$) terms. These estimates are based on: the reported GNI pc in current national units, the GDP deflator, the GNI pc in current PPP$, and the IMF estimates of the real GDP growth for 2011 and 2012. Each of these indicator series is updated or revised every year. For example, in 2011 there were no reported values for GNI for several countries for the year 2010. IMF projections were used instead. Some of these 2010 values became available in 2012 in the UN SNA Main Aggregates and were used for estimation of the 2012 GNI pc, see: http://data.un.org/Explorer.aspx?d=SNAAMA . Just as in 2011, GNI per capita estimates for 2012 is expressed in constant 2005 PPP$.Life expectancy at birth is provided by the UN Department of Economic and Social Affairs; mean years of schooling are based on UNESCO’s Institute for Statistics (UIS) educational attainment data and Barro and Lee methodology; expected years of schooling are provided by UIS; and GNI per capita by the World Bank and the International Monetary Fund. For a few countries, mean years of schooling are estimated from nationally representative household surveys, and for few countries GNI was obtained from the UN SNA Main Aggregates database. Many data gaps still exist in even some very basic areas of human development indicators. While actively advocating for the improvement of human development data, as a principle and for practical reasons, the Human Development Report Office does not collect data directly from countries.
The HDI attempts to make an assessment of 187 diverse countries and areas, with very different price levels. To compare economic statistics across countries, the data must first be converted into a common currency. Unlike market exchange rates, PPP rates of exchange allow this conversion to take account of price differences between countries. In that way GNI per capita (PPP US$) better reflects people's living standards. In theory, 1 PPP dollar (or international dollar) has the same purchasing power in the domestic economy of a country as US$1 has in the US economy. The new PPP values have been used since 2008. The latest International Comparison Survey ICP, from which the PPPs are calculated, was done in 2005; 146 countries took part in the survey, which were 26 more than in the previous one. For further discussion on the PPP, see Human Development Indices – A statistical update 2008 (Section 2). For computation of the 2011 HDI, GNI is expressed in constant 2005 PPP$. This is a change from 2010 when GNI was expressed in constant 2008 PPP$. A reason was to fully comply with the World Bank’s and IMF’s standards for expressing the monetary variables in 2005 constant international (PPP) dollars. This change had a differential impact on countries but on average the change was minimal.
No. GNI per capita only reflects average national income. It tells nothing of how that income is spent, whether on universal health, education or military expenditure. Comparing rankings on GNI per capita and the HDI can reveal much about the results of national policy choices. For example, a country with a very high GNI per capita, such as Kuwait which has a relatively low mean years of schooling for its adult population, can have a lower HDI rank than, say, Barbados, which has less than 30% of the GNI per capita of Kuwait.
Prior to 2010, HDI cut-off points were set as absolute values, and were inevitably somewhat arbitrary. With the new classifications, the approach is explicitly relative -- based on quartiles. The new classification also reduces the amount of variation within each group: previously the medium human development group ranged from 0.500 to 0.799, whereas now the effective range is 0.536 to 0.710. It does however mean that the size of each group depends on the total number of ranked countries and that some countries may enter lower classification even if they continue to make progress In these cases we would stress focusing on the change in the HDI value over time (see Table 2), and underline that the classifications are relative, not absolute. The low group, as in 2011, is the bottom 46 countries.
No. The concept of human development is much broader than what can be captured in the HDI, or any other of the composite indices in the Human Development Report (Inequality-adjusted HDI, Gender Inequality Index and Multidimensional Poverty Index). The HDI, for example, does not reflect political participation or gender inequalities. The HDI and the other composite indices can only offer a broad proxy on some of the key issues of human development, gender disparity and human poverty. A fuller picture of a country's level of human development requires analysis of other indicators and information presented in the statistical annex of the report.
The HDI remains a composite index that measures progress in the three basic dimensions—health, knowledge and income. Under the previous HDI formula, health was measured by life expectancy at birth; education or “knowledge” by a combination of the adult literacy rate and school enrolment rates (for primary through university years); and income or standard of living by GDP per capita adjusted for purchasing-power parity (PPP US$).
Health is still measured by life expectancy at birth. But since 2010, in the knowledge component of the HDI is measured by combining the expected years of schooling for a school-age child in a country entering school today with the mean years of prior schooling for adults aged 25 and older. The income measurement, meanwhile, has changed from purchasing-power-adjusted per-capita Gross Domestic Product (GDP) to purchasing-power-adjusted per-capita Gross National Income (GNI); GNI includes some remittances, providing a more accurate economic picture of many developing countries.The indicators were changed for several reasons. For example, adult literacy used in the old HDI (which is simply a binary variable, literate or illiterate, with no gradations) is an insufficient measure for knowledge achievement. By including average years of schooling and expected years of schooling, one can better capture the level of education and recent changes.
Gross Domestic Product (GDP) is the monetary value of goods and services produced in a country irrespective of how much is retained in the country. Gross National Income (GNI) expresses the income accrued to residents of a country, including some international flows, and excluding income generated in the country but repatriated abroad. Thus, GNI is a more accurate measure of a country’s economic welfare. As shown in the 2010 Report, significant differences could exist between the income of a country’s residents, measured by GNI or GDP.Unlike the old HDI, the new HDI based on the geometric mean takes into account differences in achievement across dimensions. Poor performance in any dimension is now directly reflected in the new HDI, which captures how well a country’s performance is across the three dimensions. That is to say, a low achievement in one dimension is not anymore linearly compensated for by high achievement in another dimension. The geometric mean reduces the level of substitutability between dimensions and at the same time ensures that a 1% decline in index of say life expectancy at birth has the same impact on the HDI as a 1% decline in education or income index. Thus, as a basis for comparisons of achievements, this method is also more respectful of the intrinsic differences across the dimensions than a simple average.
Income is instrumental to human development, but the contribution diminishes as incomes rise. GDP in the previous HDI was capped at $40,000 and was logarithmically transformed. The original HDI placed this cap on income to reflect the view that beyond some upper set amount, additional income does not expand human development opportunities. A further consideration was that while literacy rates and school enrolment and life expectancy have “natural” caps (100%, mortality limits, and so on forth), the highest incomes would continue rising, skewing the upper ranks of the HDI to increasingly income-driven values and rankings over time.
There are other reasons why the cap on income is lifted. First, countries were increasingly bunched at the cap. This meant that we could not distinguish among an increasing number of countries at the top of the distribution. In 2007, the GDP of 13 countries exceeded the cap. Thus, the discriminatory power of capped income has been weakened, especially for discrimination between the very high developed countries. Second, it was not originally intended to be binding in the sense of totally disregarding additional income beyond a particular level. For example, the income cap of PPP $40,000 was not binding on countries when it was introduced in the mid-1990s but rather was an upper bound used to normalize the income dimension index. Third, the use of geometric mean intensifies the diminishing returns of the logarithmic transformation of GNI compared to the arithmetic mean. Fourth, and very importantly, the use of real maximum values instead of caps allows the resulting dimensional indices to vary in similar ranges so that their implicit weights are more similar than had been the case under the previous method.
The new HDI uses the natural logarithm instead of the previously used logarithm with the base of 10. This minor change has no effect on the value of the income index and is motivated by the fact that most of the economic literature uses the natural logarithm of income. The caps in each dimension are lifted so one can say that they are equal to the observed maxima over the period (1980-2012) for which HDI trends are presented.This is based on historical evidence (Maddison, 2010, and Riley, 2005), which indicates 20 years as the minimum. If a society or a subgroup of society has a life expectancy below the typical age of reproduction, that society would die out. Lower values have occurred during some crises, such as the Rwandan genocide, but these were exceptional cases that were not sustainable. See:
Maddison, A. 2010. Historical Statistics of World Economy: 1-2008 AD. Paris: Organization for Economic Cooperation and Development.
Riley, J.C. 2005. Poverty and Life Expectancy. Cambridge, UK: Cambridge University Press.
Noorkbakhsh (1998). The Human Development Index: Some Technical Issues and Alternative Indices. Journal of International Development 10, 589-605.
There are arguments for and against transforming the health and education variables to account for diminishing returns. It is true that health and education are not only of intrinsic value; they, like income, are instrumental to other dimensions of human development not included in the HDI (Sen, 1999). Thus, their ability to be converted into other ends may likewise incur diminishing returns. The approach is to value each year of age or education equally, and therefore the principle has been applied only to the income indicator.
The new HDI assigns equal weight to all three dimension indices; the two education sub-indices are also weighted equally. This is different from the previous HDI, which weighted them differentially. The choice of weights is based on the normative judgment that all three dimensions are equally important. Research papers that provide a statistical justification for this approach include Noorkbakhsh (1998) and Decanq and Lugo (2009). The new HDI has more equal ranges of variation of dimension indices than the previous one, implying that the effective weighting is more equal than it was before. See:
Decanq, K. and Lugo, M.A. 2009. Weights in Multidimensional Indices of Well-Being. OPHI working paper No. 18. (To appear in Economic Reviews)The changes in the indicators and method of aggregation have resulted in substantial changes for a number of countries. Adopting the geometric mean of aggregation produces lower index values for all countries because the extent to which a higher achievement in one dimension can compensate lower achievement in other dimensions is reduced. The average decline is about 7% with the largest changes occurring in countries with uneven achievement across dimensions.