
How large are global carbon inequalities and what can we do about it? A new study “Climate Change & the Global Inequality of Carbon Emissions” provides novel findings on carbon emissions of individuals, based on a newly assembled set of economic inequality and environmental data available on the World Inequality Database (www.wid.world). This work was carried out in partnership with the United Nations Development Programme.
The key findings of the study are summarized below:
- Annual global emissions of greenhouse gases reached 50 billion tonnes of carbon dioxide equivalents (CO2) in 2019, i.e. around 6.6 tonnes of CO2 per capita. In 2021, global emissions have almost recovered to their pre-pandemic peak.
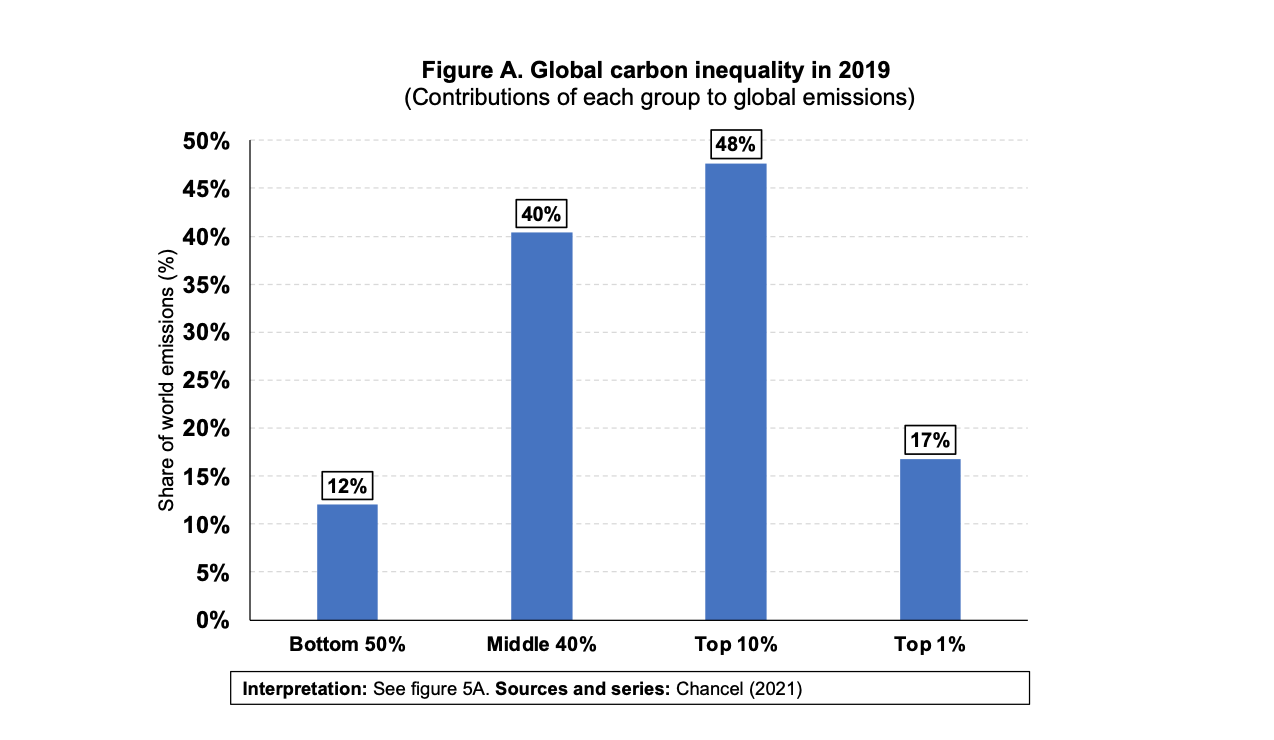
- At the global level in 2019, the top 10% of global emitters (771 million individuals) emit on average 31 tonnes of CO2 per person per year and are responsible for about 48% of global CO2 emissions. The bottom 50% (3.8 billion individuals) emit on average 1.6 tonnes and are responsible for close to 12% of all emissions. The global top 1% emit on average 110 tonnes and contributed to 17% of all
- Global inequality in per capita emissions is due to large inequalities in average emissions between countries and to even larger inequalities in emissions within each country. Currently, average emissions in Europe are close to 10 tonnes of CO2 per person and per year. In North America, the average individual emits around 20 tonnes. This drops to is 8 tonnes in China, 2.6 tonnes in South & South-East Asia and 1.6 tonnes in Sub-Saharan Africa.
- Historical emissions inequality between regions is very large: North America and Europe are responsible for around half of all emissions since the Industrial Revolution. China contributed to about 11% of the historical total and Sub-Saharan Africa just 4%.
- Since 1990, emissions from the top 1% of people have risen faster than any other group because of the higher-than-average rise in the income and wealth of this group and because of the carbon impact of their investments.
- Per-capita emissions levels of the poorest half of the global population increased only moderately since 1990, from 1.2 tonnes to 1.6 tonnes over the period. The average emissions of the global bottom 50% remain today about 4 times below the global average and the poorest billion people i emit less than one tonne CO2 per capita per annum.
- In many rich countries, the per capita emissions of the poorest half of the population have declined since 1990, contrary to that of wealthier groups. Current emissions levels of the poorest half of the population are close to per-capita 2030 climate targets in the US, the UK, Germany or France. In these countries, policy efforts should arguably be largely focused on reducing emissions levels of the top half of the population and, in particular, of the top 10%. In low-income and emerging countries, while certain groups will see their emissions levels rise in the coming decades, urgent action is needed to curb emissions of the wealthy.
- While governments officially report the carbon emitted within their own territory, they do not produce systematic data on the carbon imported in goods and services that are imported. Factoring-in these emissions (as we do in this study), increases European emission levels by around 25% and reduces reported emissions in China and Sub-Saharan Africa by around 10% and 20%, respectively.
- Since the industrial revolution, around 2500 billion tonnes of CO2 have been emitted by humankind. Based on current emissions rates, the remaining carbon budget to limit global warming to 2°C above preindustrial levels (that is, 900 billion tonnes of CO2) will be entirely depleted in 18 years. To limit global warming to 1.5°C, the remaining budget (300 billion tonnes of CO2) will be depleted in 6 years.
Based on these findings, the study formulates a series of policy recommendations:
- Monitoring. Countries do not possess basic, up-to-date information to track carbon emissions inequalities. It is urgent to develop public monitoring systems to measure carbon emissions of individuals, with a particular focus on carbon emissions embedded in consumption and in investment portfolios.
- Reporting. Based on improved carbon inequality data, public deliberation could set clear targets in terms of emissions reductions per capita (not only in terms of national totals) and develop information systems enabling individuals to check the distance between their own emissions levels and national per capita targets. A systematic assessment of the beneficiaries and losers from climate policies should also be carried out by public authorities.
- Taxation. Climate policies have been disproportionately borne by low-income consumers over the past decades, in particular, via carbon and energy taxes. More emphasis should be placed on wealthy polluters (see Table A for different policy options impacting different parts of the income distribution). This can be done via policy instruments targeting investments in polluting and fossil activities. Progressive wealth taxes on the ownership of polluting businesses could accelerate divestments, reduce pollution levels of the wealthiest and generate much-need resources to scale-up investments in low-carbon infrastructures. Ultimately, the ownership and sale of assets associated with new fossil fuel projects should be prohibited.
- Earmarking. Public actors must significantly scale-up their investments in low-carbon energy production infrastructure, transport and energy efficiency in order to ensure a fair transition. Overall, additional annual investments in the energy transition of around 2% of global GDP are needed (representing an additional $1800bn in 2021). A relatively modest progressive global wealth tax with a pollution top-up, such as the one presented in this study, could generate 1.7% of global income. A significant part of these revenues can be earmarked towards the green transition to finance climate investments without additional financial cost for low- and middle-income groups.
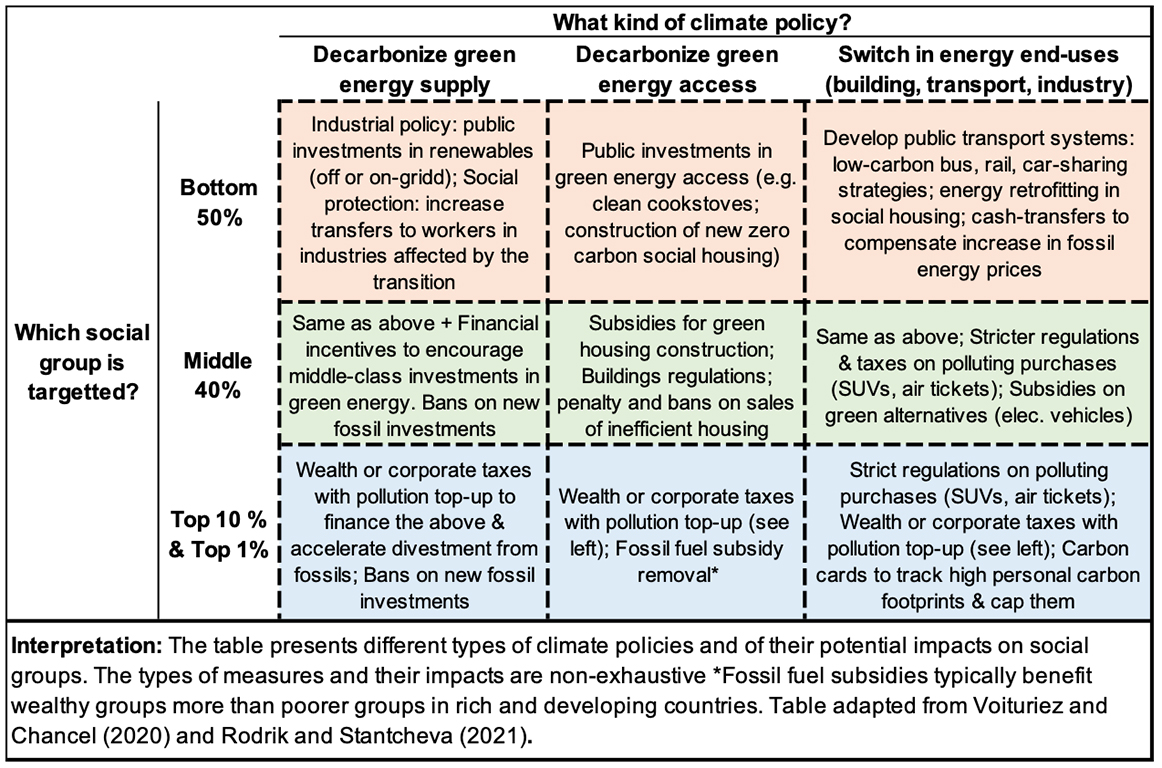
Table A. An inequality reality-check for climate policies
This blog article is based on the Executive Summary of the Study, which you can access at this link: https://wid.world/news-article/climate-change-the-global-inequality-of-carbon-emissions/