2021 Global Multidimensional Poverty Index (MPI)
Unmasking disparities by ethnicity, caste and gender
UNDP (United Nations Development Programme). 2021. 2021 Global Multidimensional Poverty Index (MPI): Unmasking disparities by ethnicity, caste and gender. New York.
2021 Global Multidimensional Poverty Index (MPI)
Unmasking disparities by ethnicity, caste and gender
This report provides a comprehensive picture of acute multidimensional poverty to inform the work of countries and communities building a more just future for the global poor. Part I focuses on where we are now. It examines the levels and composition of multidimensional poverty across 109 countries covering 5.9 billion people. It also discusses trends among more than 5 billion people in 80 countries, 70 of which showed a statistically significant reduction in Multidimensional Poverty Index value during at least one of the time periods presented. While the COVID-19 pandemic’s impact on developed countries is already an active area of research, this report offers a multidimensional poverty perspective on the experience of developing countries. It explores how the pandemic has affected three key development indicators (social protection, livelihoods and school attendance), in association with multidimensional poverty, with a focus predominantly on Sub-Saharan Africa. Part II profiles disparities in multidimensional poverty with new research that scrutinizes estimates disaggregated by ethnicity or race and by caste to identify who and how people are being left behind. It also explores the proportion of multidimensionally poor people who live in a household in which no female member has completed at least six years of schooling and presents disparities in multidimensional poverty by gender of the household head. Finally, it probes interconnections between the incidence of multidimensional poverty and intimate partner violence against women and girls. The publication of the 2021 Multidimensional Poverty Index Report was supported by financial contribution by the Republic of Korea.
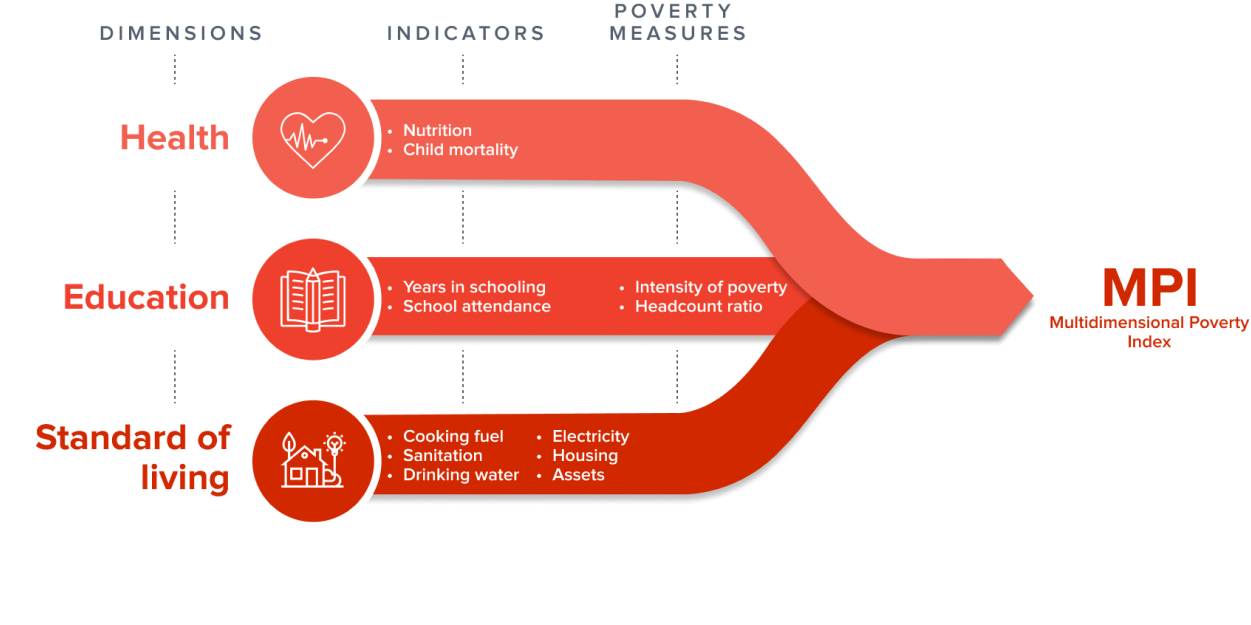
MPI Dimensions and Indicators
Key Findings - Worldwide, across 109 countries and 5.9 billion people:
1.3
billion people
67
More than 67 percent
644
million
556
million
Annex: The dimensions, indicators, deprivation cutoffs, and weights of the global Multidimensional Poverty Index
| Dimensions of Poverty | Indicator | Deprived if living in the household where… | Weight |
|---|---|---|---|
| Health | Nutrition | Any adult under 70 years of age or any child for whom there is nutritional information is undernourished.1 | 1/6 |
| Child mortality | Any child under the age of 18 years has died in the family in the five-year period preceding the survey.2,3 | 1/6 | |
| Education | Years of schooling | No household member aged ‘school entrance age + six4 years or older has completed at least six years of schooling. | 1/6 |
| School attendance | Any school-aged child is not attending school up to the age at which he/she would complete class eight.5 | 1/6 | |
| Standard of living | Cooking Fuel | The household cooks with dung, wood, charcoal or coal. | 1/18 |
| Sanitation | The household’s sanitation facility is not improved (according to SDG guidelines) or it is improved but shared with other households.6 | 1/18 | |
| Drinking Water | The household does not have access to improved drinking water (according to SDG guidelines) or improved drinking water is at least a 30-minute walk from home, round trip.7 | 1/18 | |
| Electricity | The household has no electricity.8 | 1/18 | |
| Housing | At least one of the three housing materials for roof, walls and floor are inadequate: the floor is of natural materials and/or the roof and/or walls are of natural or rudimentary materials.9 | 1/18 | |
| Assets | The household does not own more than one of these assets: radio, television, telephone, computer, animal cart, bicycle, motorbike or refrigerator, and does not own a car or truck.10 | 1/18 |
1. Adults 19 to 70 years of age (229 to 840 months) are considered undernourished if their Body Mass Index (BMI) is below 18.5 kg/m2. Those 5 to 19 years (61 to 228 months) are identified as undernourished if their age-specific BMI values are below minus two standard deviations from the median of the reference population (https://www.who.int/growthref/en/). In the majority of the countries, BMI-for-age covered people aged 15 to 19 years, as anthropometric data was only available for this age group; if other data were available, BMI-for-age was applied for all individuals 5 to 19 years. Children under 5 years (60 months and under) are considered undernourished if their z-score for either height-for-age (stunting) or weight-for-age (underweight) is below minus two standard deviations from the median of the reference population (https://www.who.int/childgrowth/software/en/). Nutritional information is not provided for households without members eligible for measurement, these households are assumed to be not deprived in this indicator.
2. All reported deaths are used if the date of child’s death is not known.
3. Child mortality information is typically collected from women of reproductive ages 15-49 years. Households without women of such ages do not provide information about child’s deaths and are assumed to be not deprived in this indicator.
4. This country-specific age cutoff was introduced in 2020. Previously, the age cutoff was 10 years which did not recognize the fact that by age 10 children do not normally complete 6 years of schooling.
5. Source for official entrance age to primary school: United Nations Educational, Scientific and Cultural Organization, Institute for Statistics database. Education systems [UIS, http://data.uis.unesco.org/?ReportId=163].
6. A household is considered to have access to improved sanitation if it has some type of flush toilet or latrine, or ventilated improved pit or composting toilet, provided that they are not shared. If the survey report uses other definitions of improved sanitation, we follow the survey report.
7. A household has access to improved drinking water if the water source is any of the following types: piped water, public tap, borehole or pump, protected well, protected spring or rainwater, and it is within 30 minutes’ walk (round trip). If the survey report uses other definitions of improved drinking water, we follow the survey report.
8. A few countries do not collect data on electricity because of 100% coverage. In such cases, we identify all households in the country as non-deprived in electricity.
9. A household is considered deprived if the dwelling’s floor is made of mud/clay/earth, sand or dung; or if the dwelling has no roof or walls or if either the roof or walls are constructed using natural materials such as cane, palm/trunks, sod/mud, dirt, grass/reeds, thatch, bamboo, sticks or rudimentary materials such as carton, plastic/ polythene sheeting, bamboo with mud/stone with mud, loosely packed stones, uncovered adobe, raw/reused wood, plywood, cardboard, unburnt brick or canvas/tent.
10. Television (TV) includes smart TV and black and white TV, telephone includes cell phones, computer includes tablets and laptops, and refrigerator includes freezers.